calicocloud-aks-workshop
Module 5: Layer 7 Logging and Visibility
Goal: Enable Layer 7 visibility for Pod traffic.
Calico Cloud can be enabled for Layer 7 application visibility which captures the HTTP calls applications are making. Application visibility does not require a service mesh but does utilize envoy for capturing logs. Envoy is deployed as part of an L7 Log Collector DaemonSet per Kubernetes node - this requires less resources than a sidecar per pod. For more info please review the documentation.
Steps
-
Configure Felix for log data collection and patch Felix with AKS specific parameters
Enable the Policy Sync API in Felix - we configure this cluster-wide
kubectl patch felixconfiguration default --type='merge' -p '{"spec":{"policySyncPathPrefix":"/var/run/nodeagent"}}' -
Since Calico Cloud v3.11 L7 visibility is deployed using an
ApplicationLayerresource. Calico’s operator will deploy the envoy and log collector containers as a daemonset. To deploy the ApplicationLayer resource:kubectl apply -f -<<EOF apiVersion: operator.tigera.io/v1 kind: ApplicationLayer metadata: name: tigera-secure spec: logCollection: collectLogs: Enabled logIntervalSeconds: 5 logRequestsPerInterval: -1 EOF -
If successfully deployed an
l7-log-collectorpod will be deployed on each node. To verify:kubectl get pod -n calico-systemOutput will look similar to:
NAME READY STATUS RESTARTS AGE calico-kube-controllers-6b4dccd6c5-579s8 1/1 Running 0 120m calico-node-b26qh 1/1 Running 0 120m calico-node-pl646 1/1 Running 0 2m2s calico-node-rmx2q 1/1 Running 0 120m calico-typha-6f7f966d4-28n9j 1/1 Running 0 122m calico-typha-6f7f966d4-8nx5f 1/1 Running 0 2m1s calico-typha-6f7f966d4-g7b69 1/1 Running 0 122m l7-log-collector-627qf 2/2 Running 0 91s l7-log-collector-6b6cx 2/2 Running 0 3m52s l7-log-collector-jxzjq 2/2 Running 0 15m -
Annotate the Boutiqueshop Services
kubectl annotate svc -n default frontend projectcalico.org/l7-logging=trueL7 flow logs will require a few minutes to generate, you can also restart pods which will enable L7 logs quicker.
Once frontend service is annotated, naviate to the
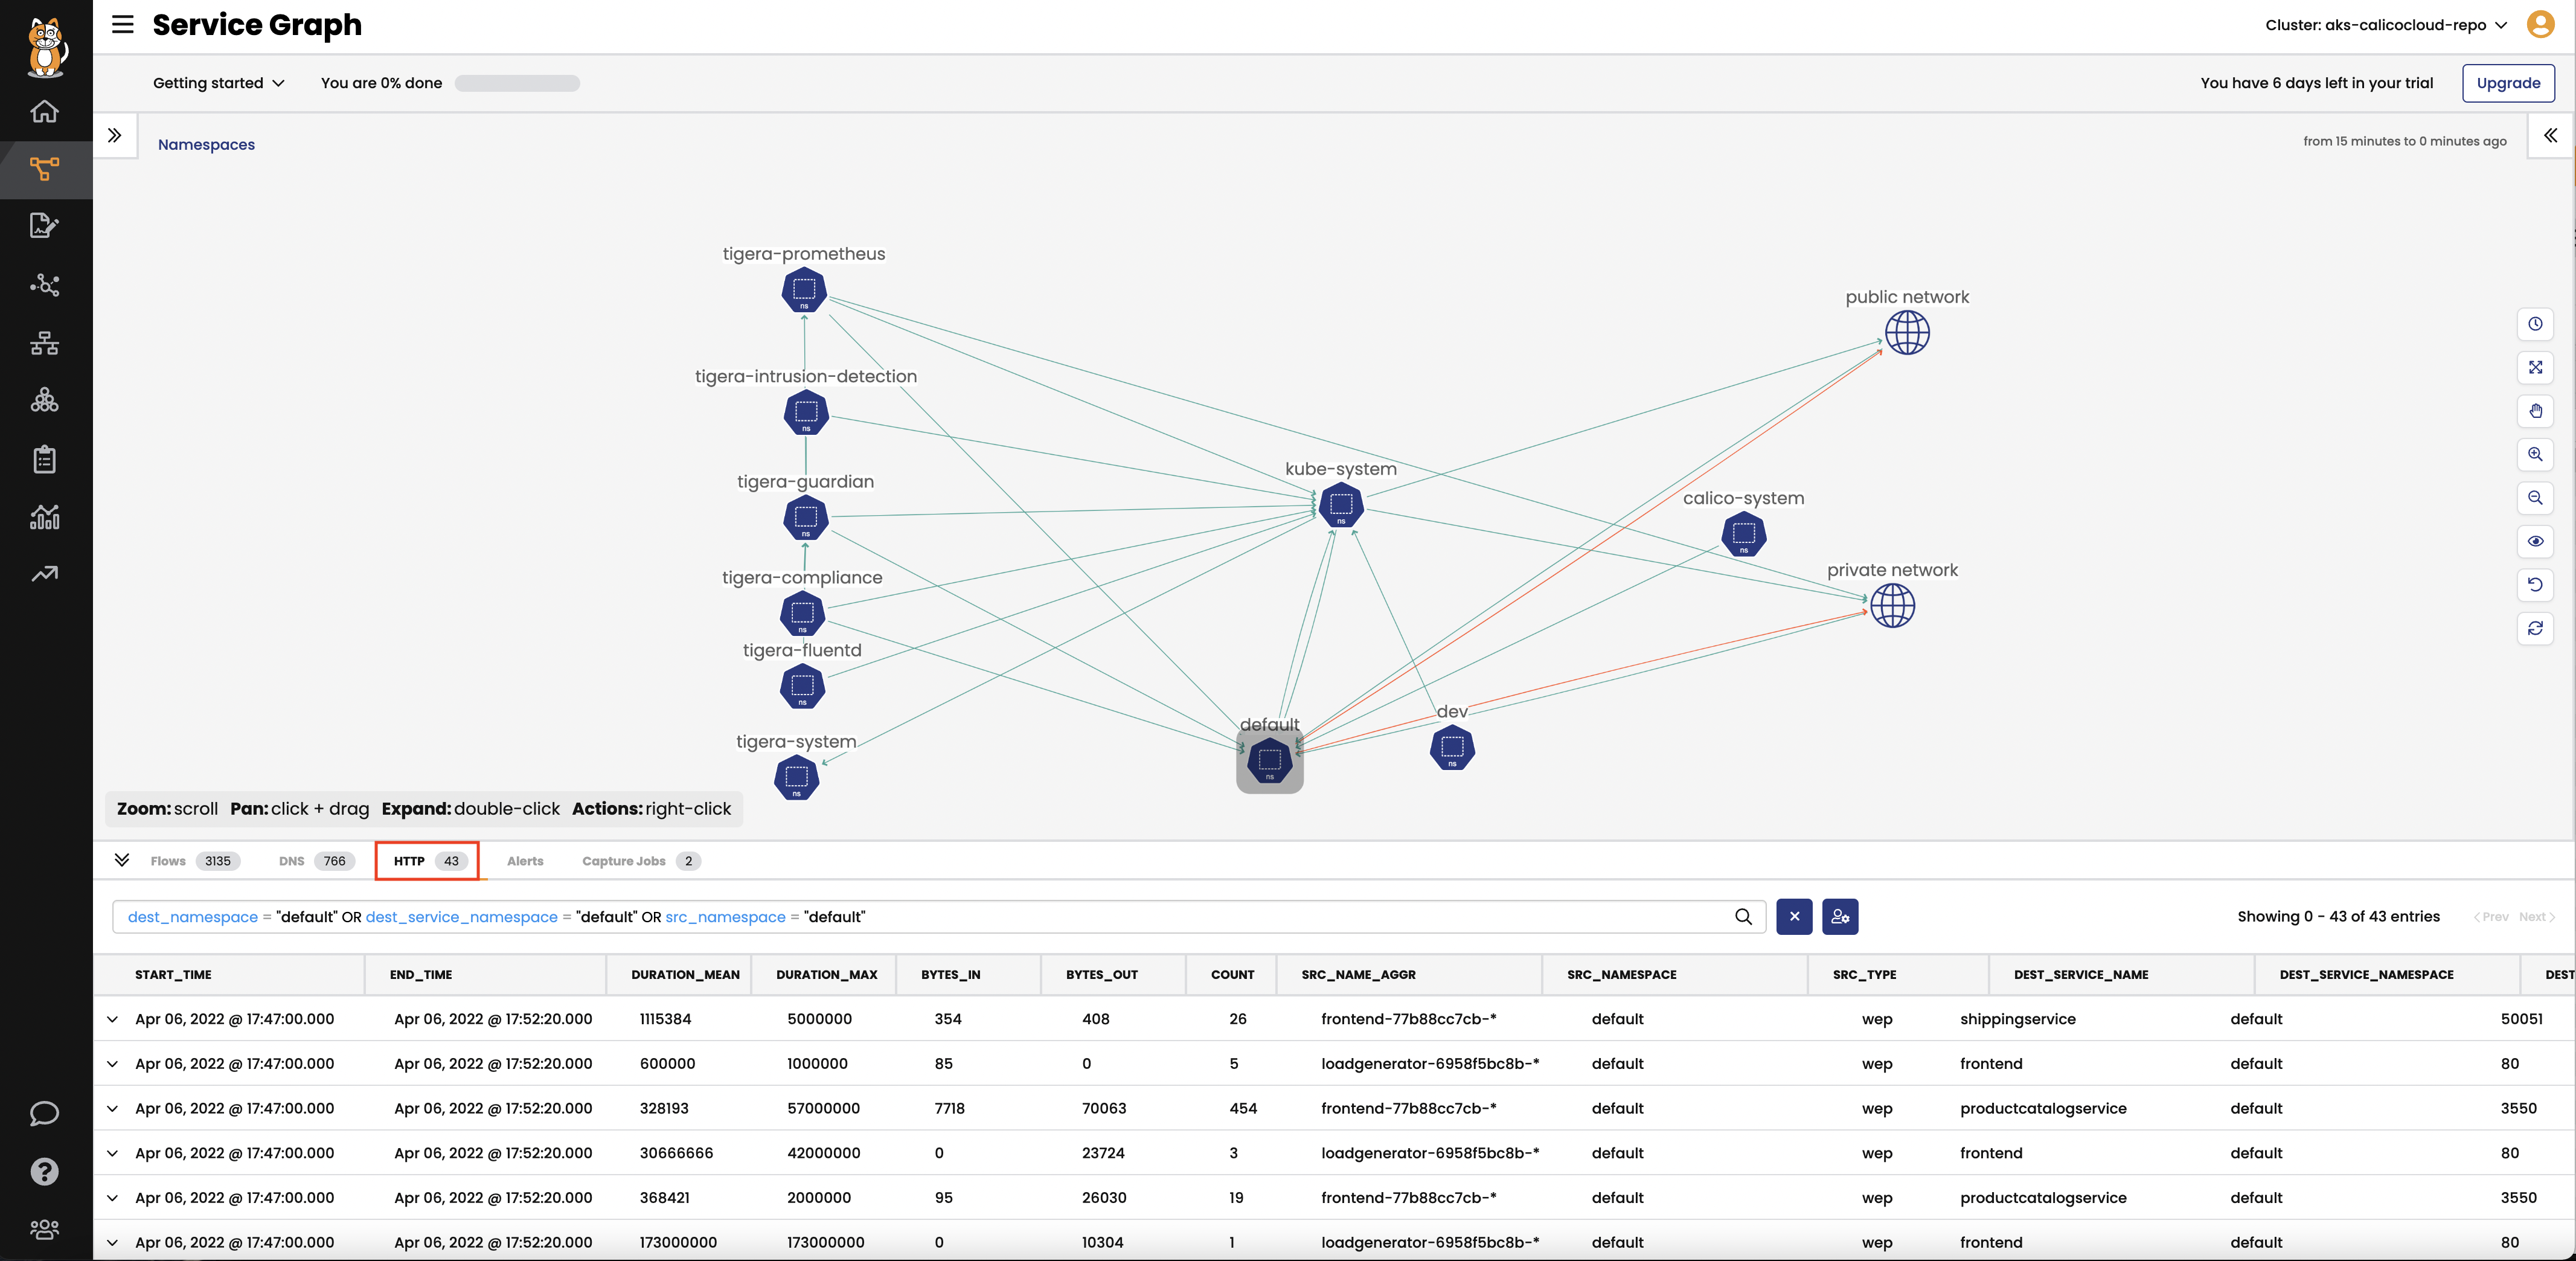
frontend-externalservice IP and perform a few actions on the website. After a few moments, you should be able to see those actions in the Service Graph under the HTTP tab. -
Review L7 logs
The HTTP logs can be reviewed from
Service Graphand then clicking theHTTPtab. Details of each flow can be reviewed by drilling down into the flow record