calicocloud-aks-workshop
Module 10: Honeypod Threat Detection
Goal: Deploy honeypod resources and generate alerts when suspicious traffic is detected
Calico offers Honeypod capability which is based upon the same principles as traditional honeypots. Calico is able to detect traffic which probes the Honeypod resources which can be an indicator of compromise. Refer to the official honeypod configuration documentation for more details.
Steps
-
Configure honeypod namespace and Alerts for SSH detection
CALICOVERSION=$(kubectl get clusterinformations default -ojsonpath='{.spec.cnxVersion}') # create dedicated namespace and RBAC for honeypods kubectl apply -f https://downloads.tigera.io/ee/${CALICOVERSION}/manifests/threatdef/honeypod/common.yaml # add tigera pull secret to the namespace. We clone the existing secret from the calico-system NameSpace kubectl get secret tigera-pull-secret --namespace=calico-system -o yaml | \ grep -v '^[[:space:]]*namespace:[[:space:]]*calico-system' | \ kubectl apply --namespace=tigera-internal -f - -
Deploy sample honeypods
# expose pod IP to test IP enumeration use case kubectl apply -f https://downloads.tigera.io/ee/${CALICOVERSION}/manifests/threatdef/honeypod/ip-enum.yaml # expose nginx service that can be reached via ClusterIP or DNS kubectl apply -f https://downloads.tigera.io/ee/${CALICOVERSION}/manifests/threatdef/honeypod/expose-svc.yaml # expose MySQL service kubectl apply -f https://downloads.tigera.io/ee/${CALICOVERSION}/manifests/threatdef/honeypod/vuln-svc.yaml -
Verify newly deployed pods are running
kubectl get pods -n tigera-internalOutput should resemble:
NAME READY STATUS RESTARTS AGE tigera-internal-app-7jlg8 1/1 Running 0 60s tigera-internal-app-lptd6 1/1 Running 0 60s tigera-internal-app-rfllv 1/1 Running 0 60s tigera-internal-dashboard-859fb4f577-6tgqj 1/1 Running 0 51s tigera-internal-db-58547d8655-hgjrc 1/1 Running 0 43s -
Verify honeypod alerts are deployed
kubectl get globalalerts | grep -i honeypodOutput should resemble:
honeypod.fake.svc 2021-10-01T18:41:55Z honeypod.ip.enum 2021-10-01T18:41:53Z honeypod.network.ssh 2021-10-01T18:40:05Z honeypod.port.scan 2021-10-01T18:41:53Z honeypod.vuln.svc 2021-10-01T18:41:56Z -
Test honeypod use cases
Ping exposed Honeypod IP
 POD_IP=$(kubectl -n tigera-internal get po --selector app=tigera-internal-app -o jsonpath='{.items[0].status.podIP}')
 kubectl -n dev exec netshoot -- ping -c5 $POD_IP
Output should resemble:
kubectl -n dev exec netshoot -- ping -c5 $POD_IP PING 10.240.0.86 (10.240.0.86) 56(84) bytes of data. 64 bytes from 10.240.0.86: icmp_seq=1 ttl=62 time=1.37 ms 64 bytes from 10.240.0.86: icmp_seq=2 ttl=62 time=1.25 ms 64 bytes from 10.240.0.86: icmp_seq=3 ttl=62 time=1.05 ms 64 bytes from 10.240.0.86: icmp_seq=4 ttl=62 time=1.16 ms 64 bytes from 10.240.0.86: icmp_seq=5 ttl=62 time=1.13 ms --- 10.240.0.86 ping statistics --- 5 packets transmitted, 5 received, 0% packet loss, time 4004ms rtt min/avg/max/mdev = 1.053/1.191/1.366/0.107 mscurlHoneypod nginx serviceSVC_URL=$(kubectl -n tigera-internal get svc -l app=tigera-dashboard-internal-debug -ojsonpath='{.items[0].metadata.name}') SVC_PORT=$(kubectl -n tigera-internal get svc -l app=tigera-dashboard-internal-debug -ojsonpath='{.items[0].spec.ports[0].port}') kubectl -n dev exec netshoot -- curl -m3 -skI $SVC_URL.tigera-internal:$SVC_PORT | grep -i httpOutput should resemble:
HTTP/1.1 200 OKQuery Honeypod MySQL service
 SVC_URL=$(kubectl -n tigera-internal get svc -l app=tigera-internal-backend -ojsonpath='{.items[0].metadata.name}')
 SVC_PORT=$(kubectl -n tigera-internal get svc -l app=tigera-internal-backend -ojsonpath='{.items[0].spec.ports[0].port}')
 kubectl -n dev exec netshoot -- nc -zv $SVC_URL.tigera-internal $SVC_PORT
Output should resemble:
Connection to tigera-internal-backend.tigera-internal 3306 port [tcp/mysql] succeeded! -
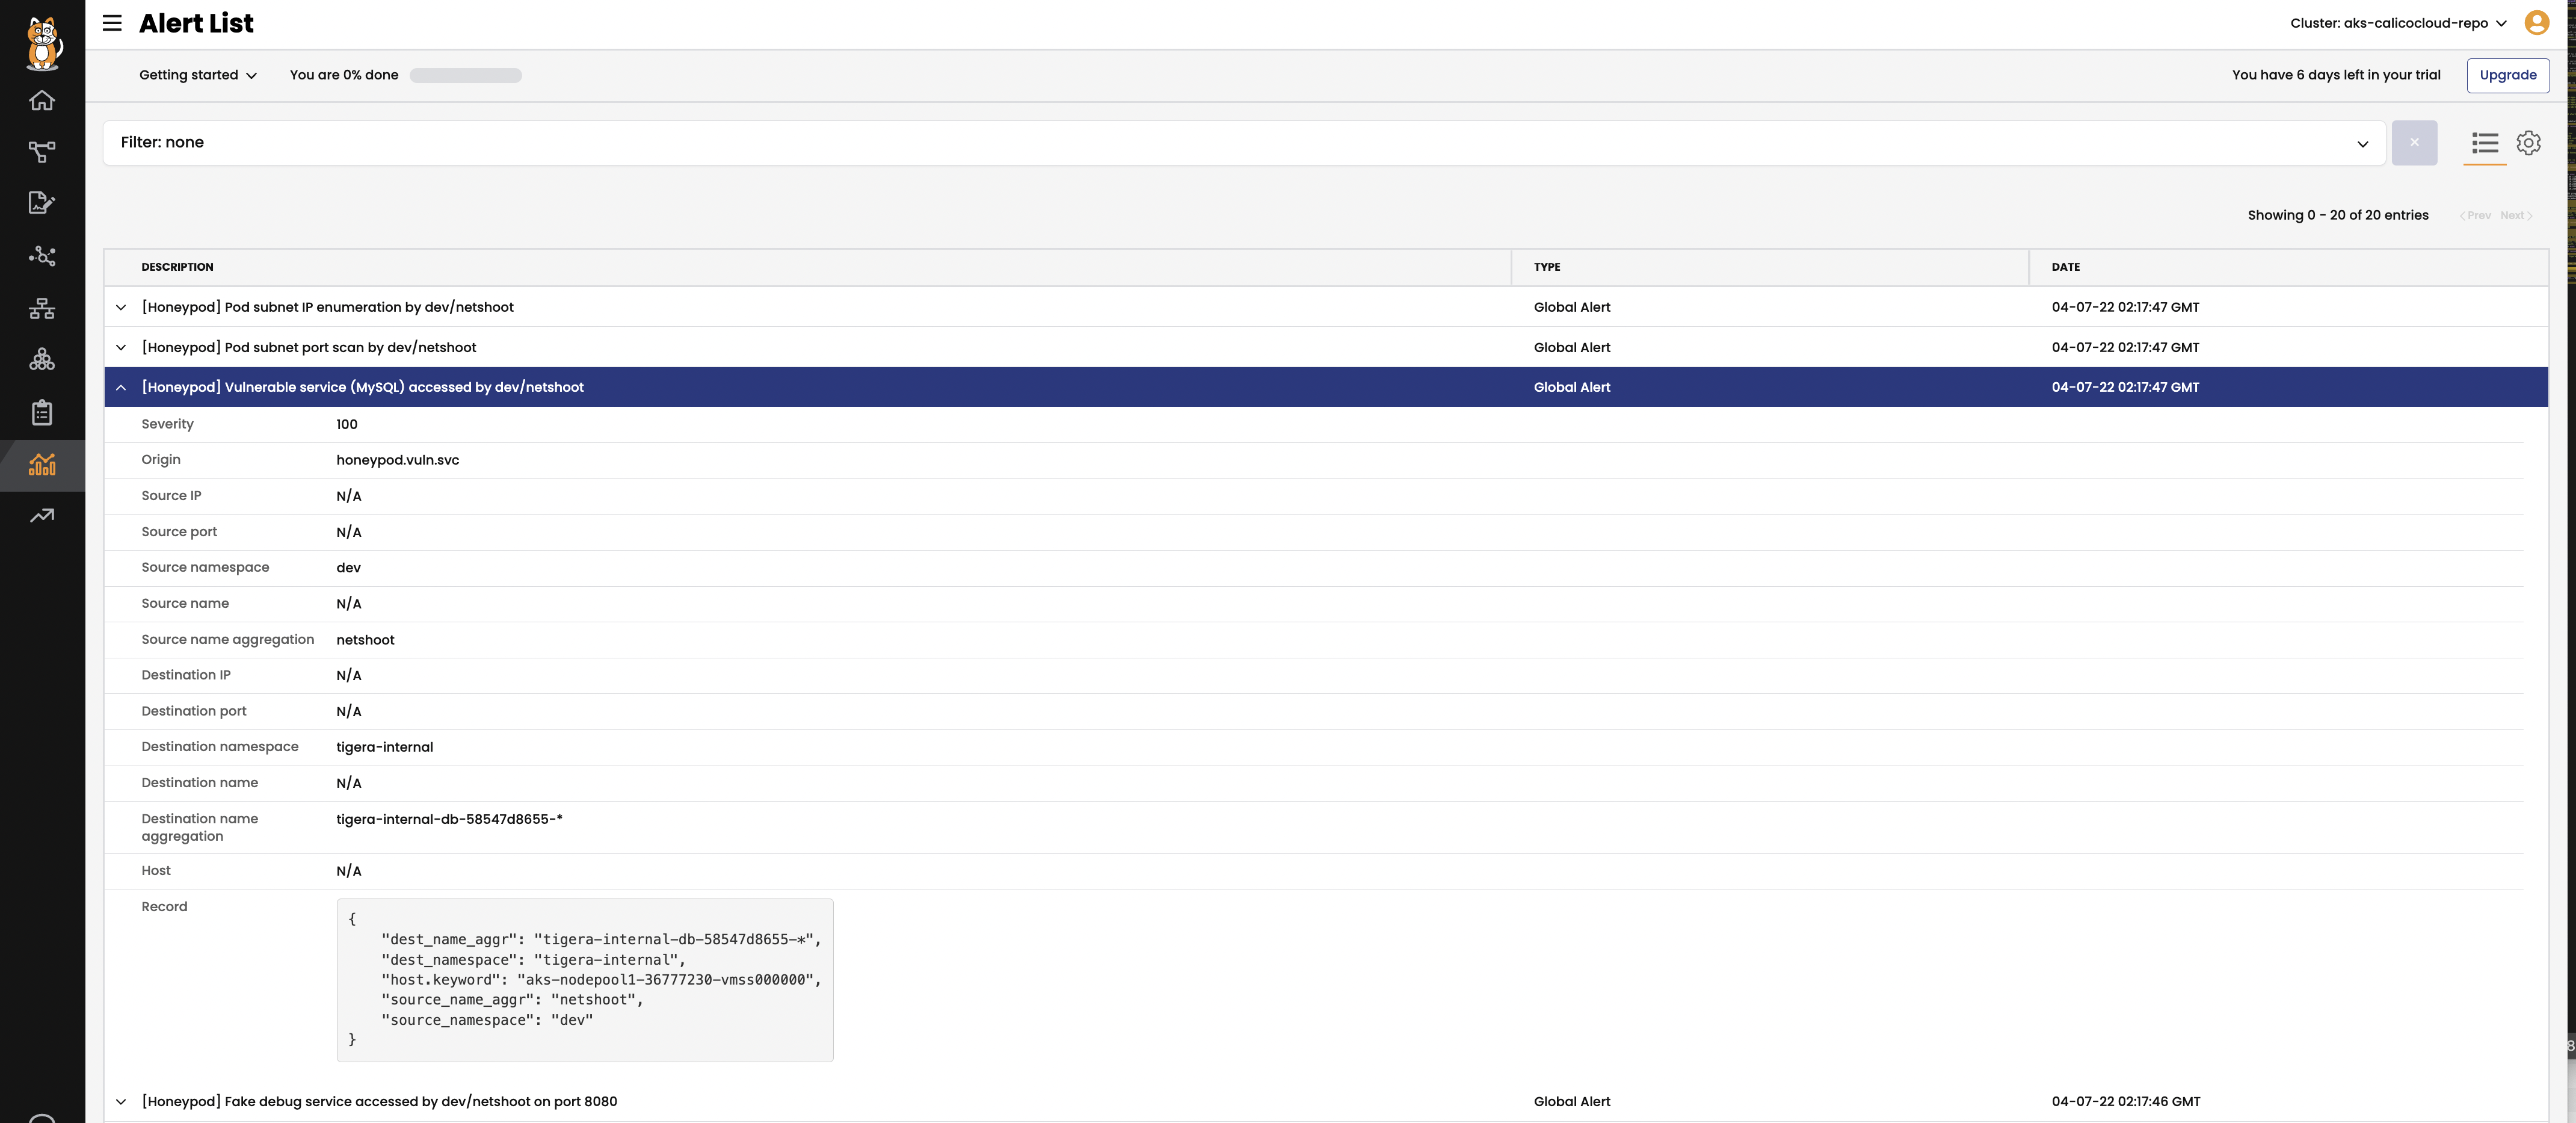
Head to
Alertsview in the Enterprise Manager UI to view the related alerts. Note the alerts can take a few minutes to generate.