calicocloud-aks-workshop
Module 1: Joining AKS cluster to Calico Cloud
Goal: Join AKS cluster to Calico Cloud management plane.
IMPORTANT: In order to complete this module, you must have Calico Cloud trial account. Issues with being unable to navigate menus in the UI are often due to browsers blocking scripts - please ensure you disable any script blockers.
Steps
-
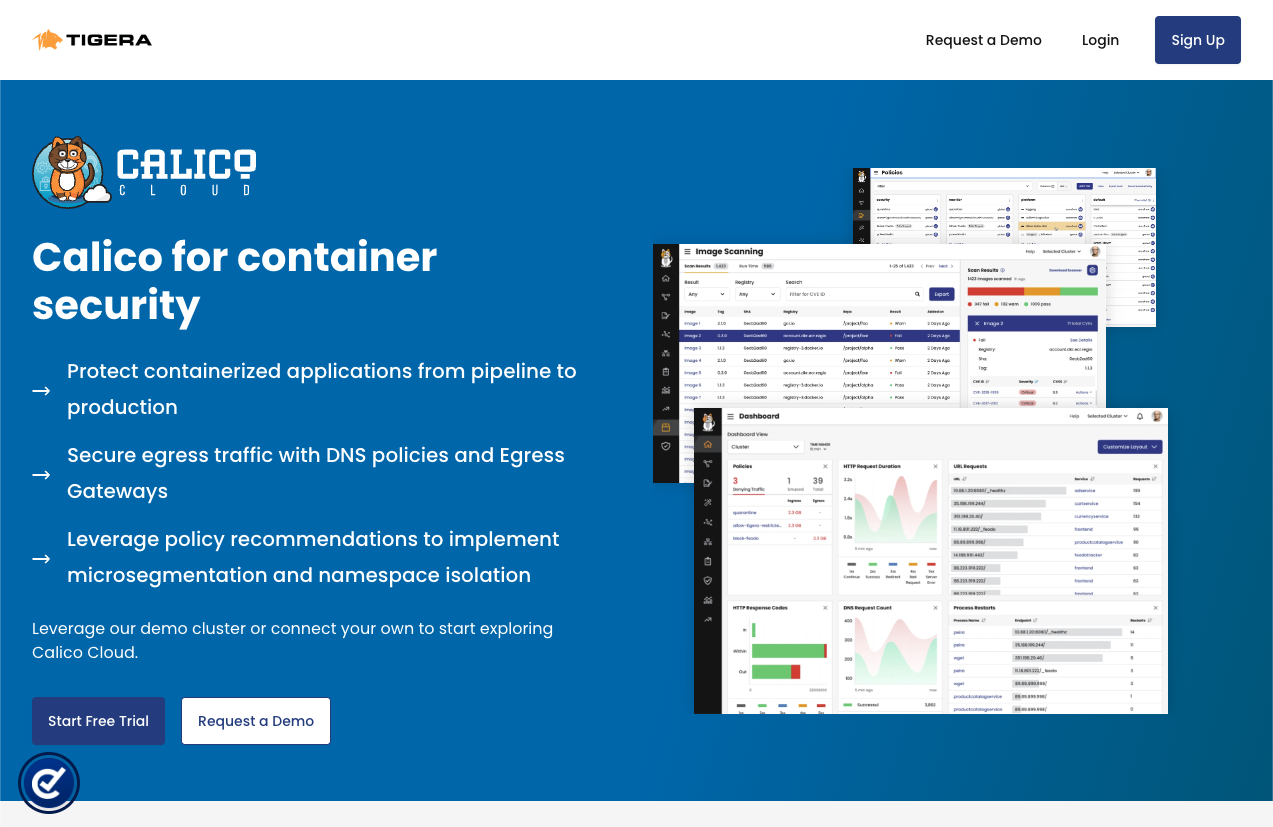
Navigate to calicocloud.io and sign up for a 14 day trial account - no credit cards required. Returning users can login.
-
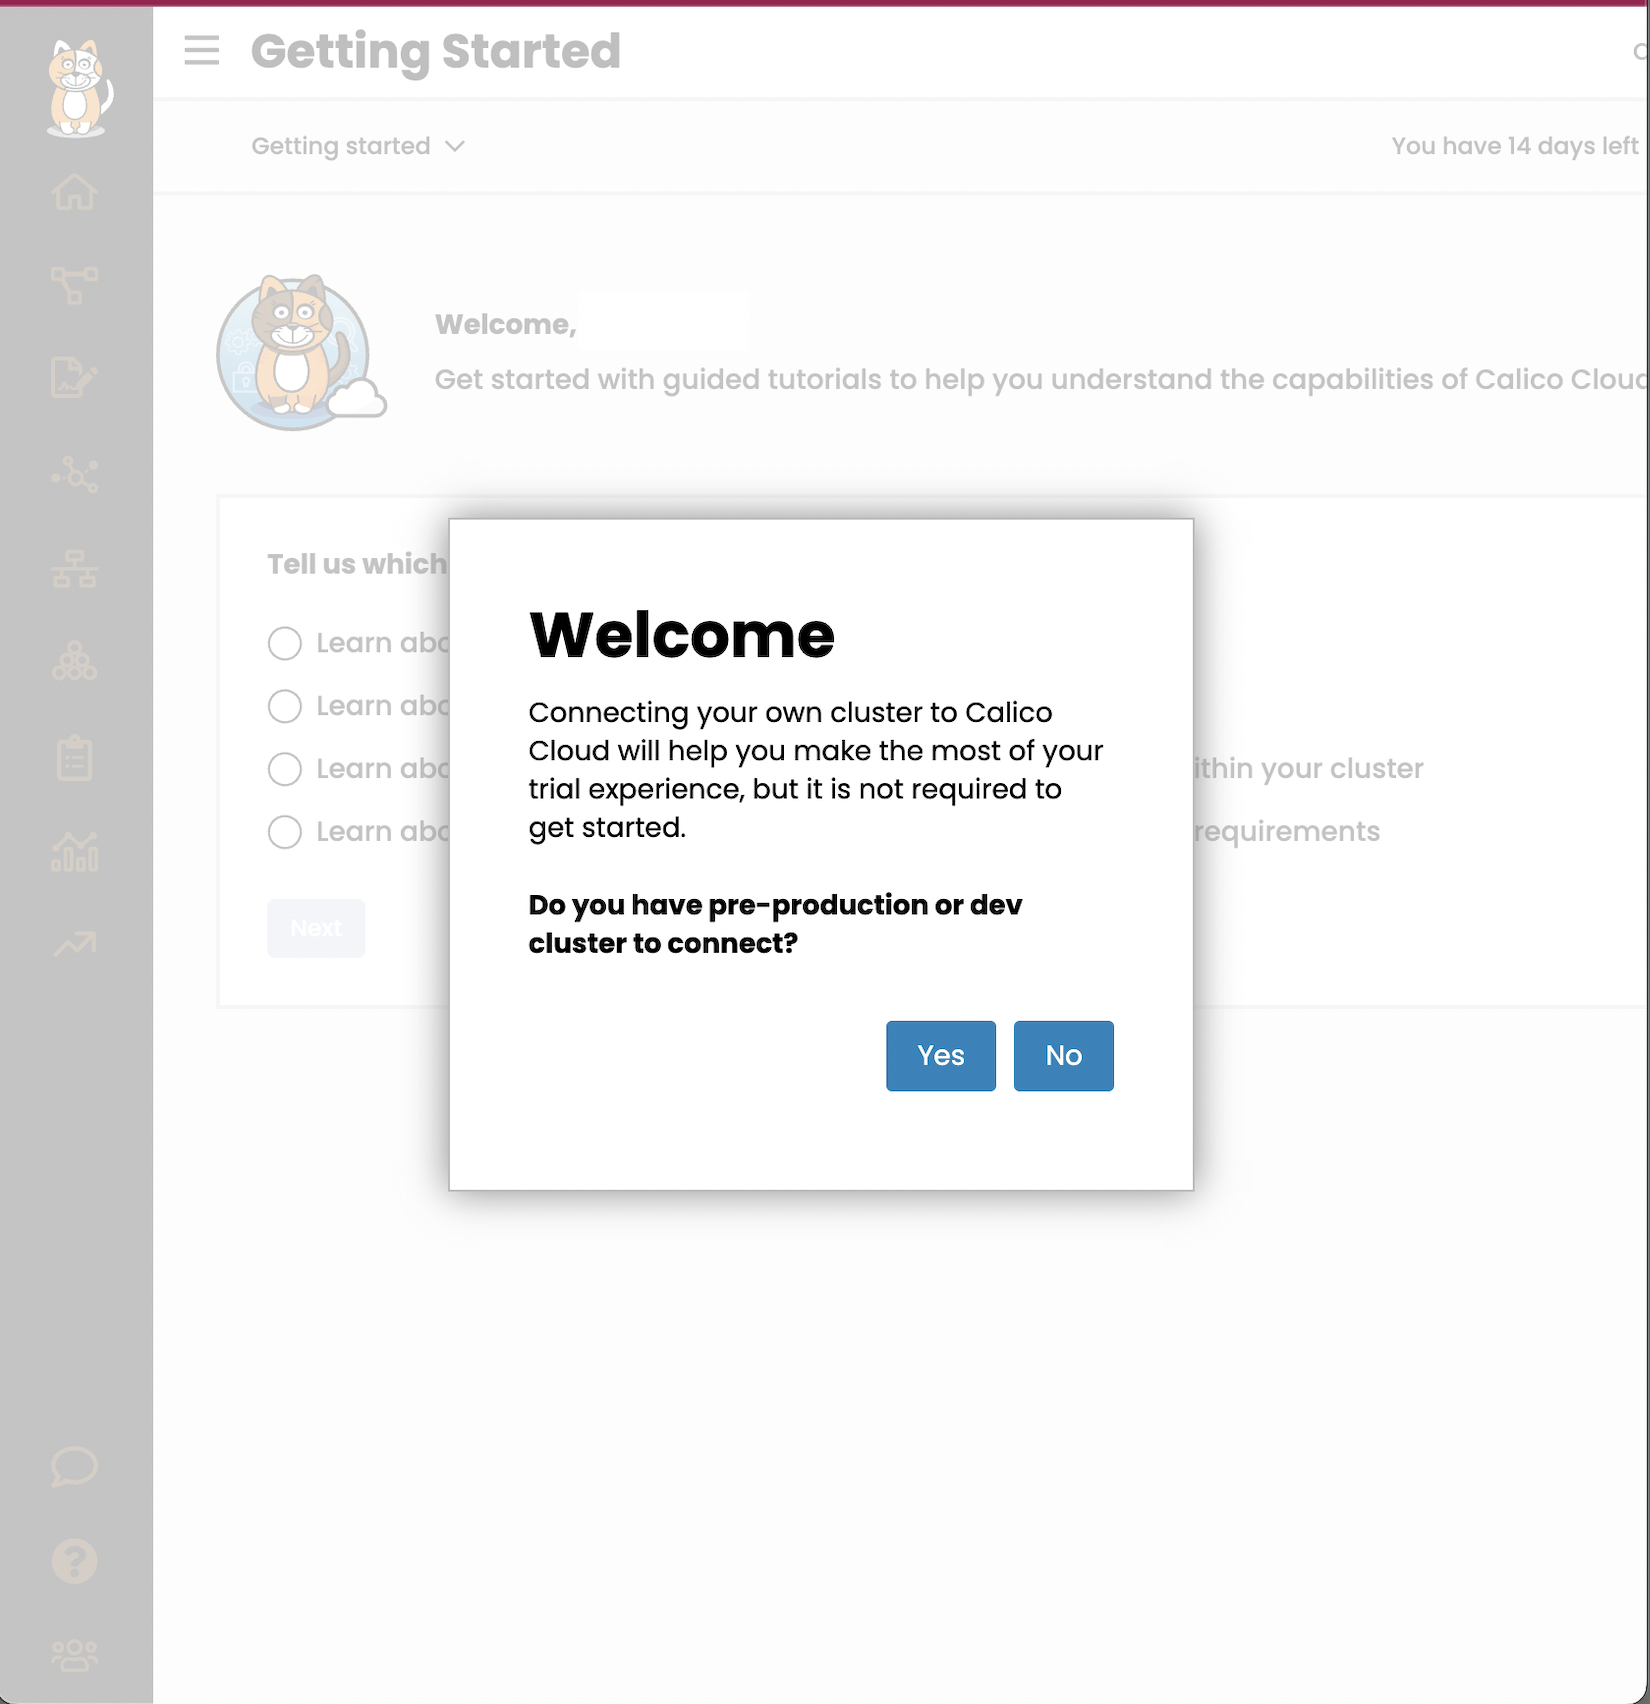
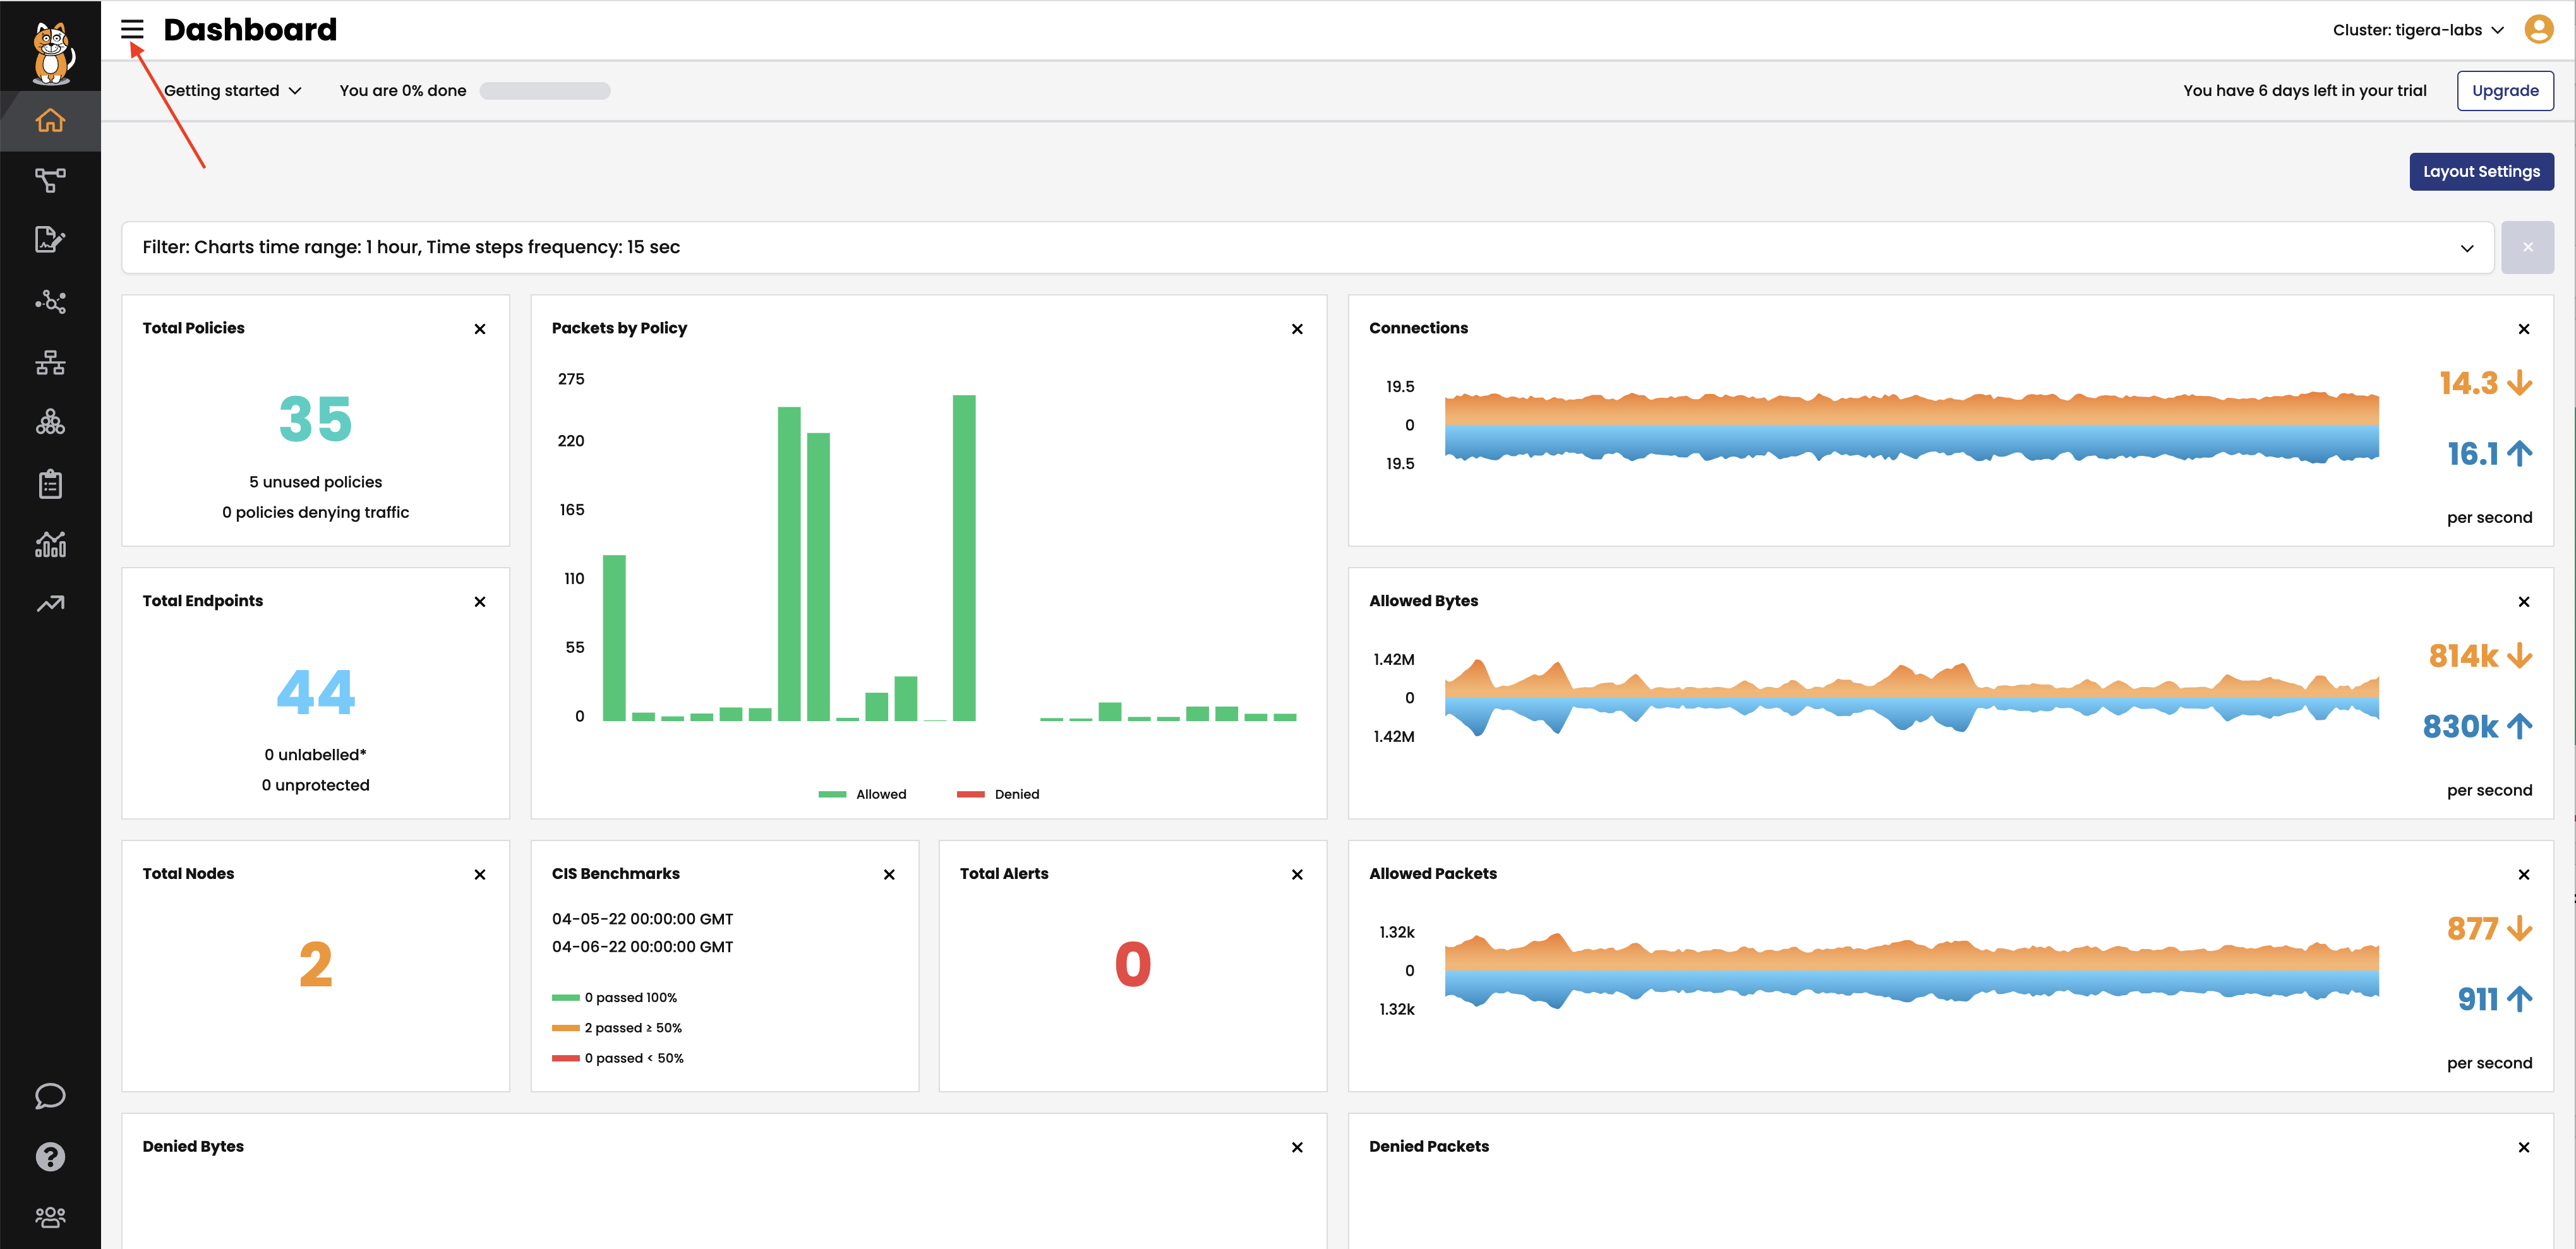
Upon signing into the Calico Cloud UI the Welcome screen shows four use cases which will give a quick tour for learning more. This step can be skipped. Tip: the menu icons on the left can be expanded to display the worded menu as shown:
-
Join AKS cluster to Calico Cloud management plane.
Click the “Managed Cluster” in your left side of browser.
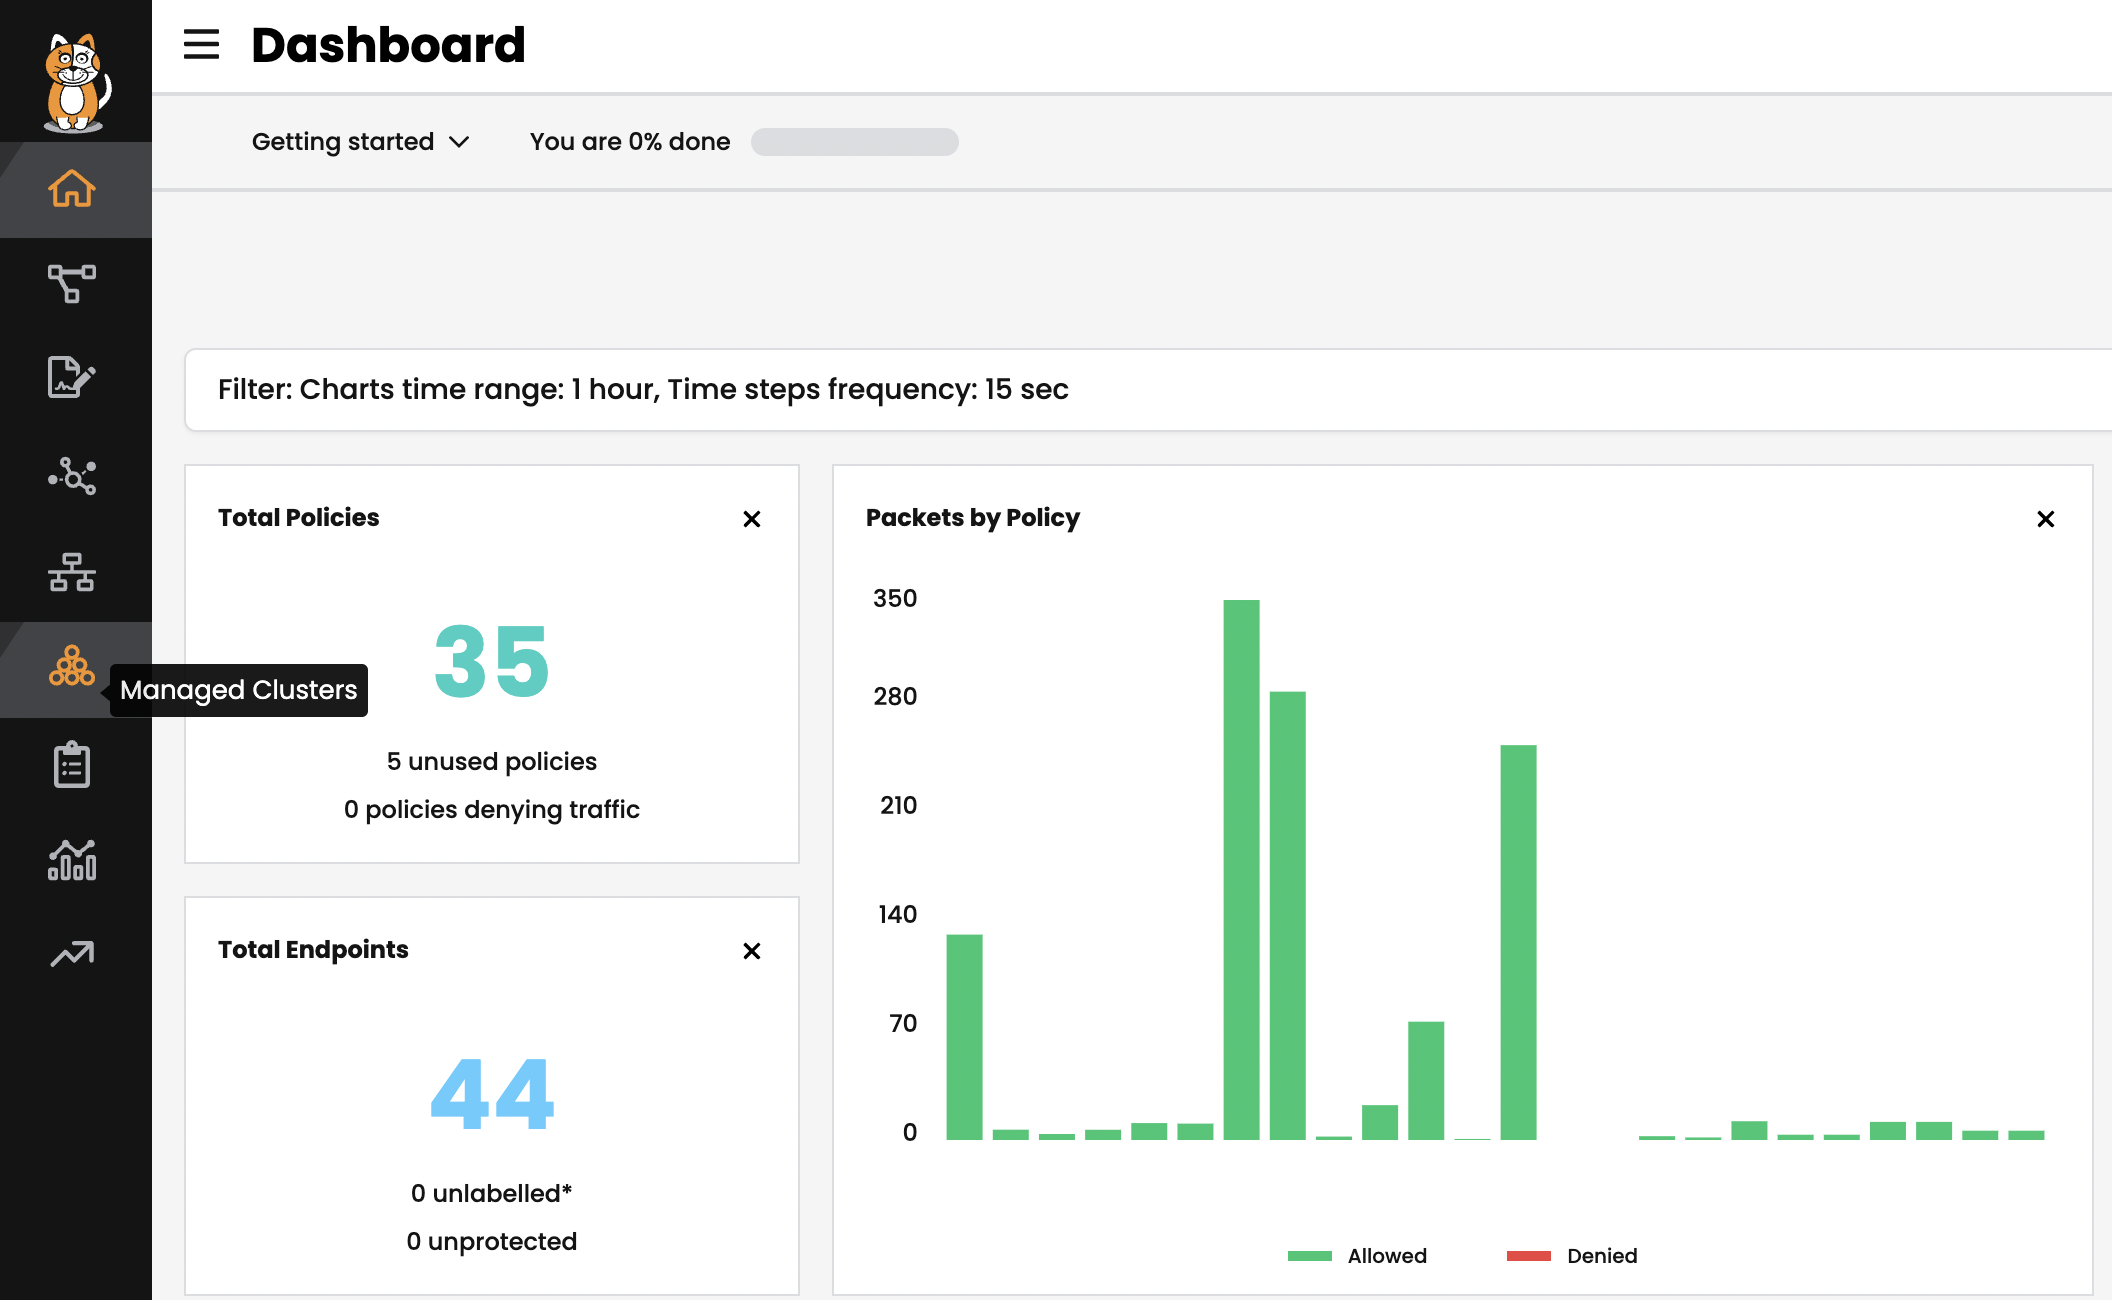
Click on “connect cluster”

choose AKS and click next
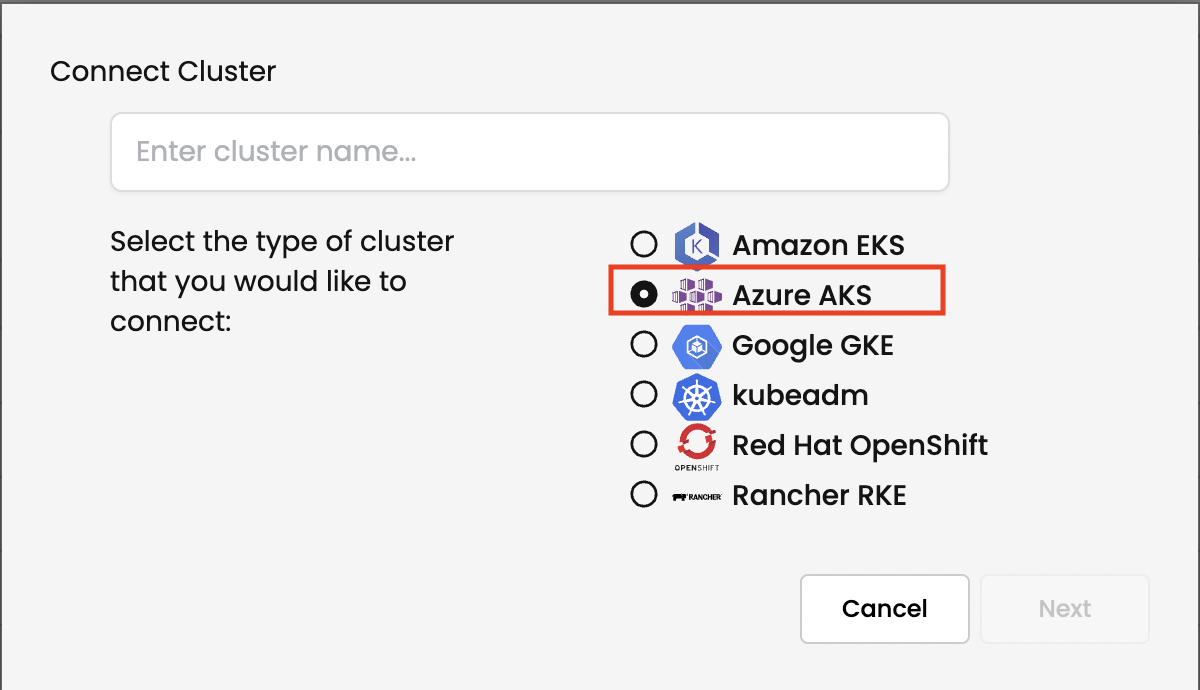
Run installation script in your aks cluster, script should look similar to this
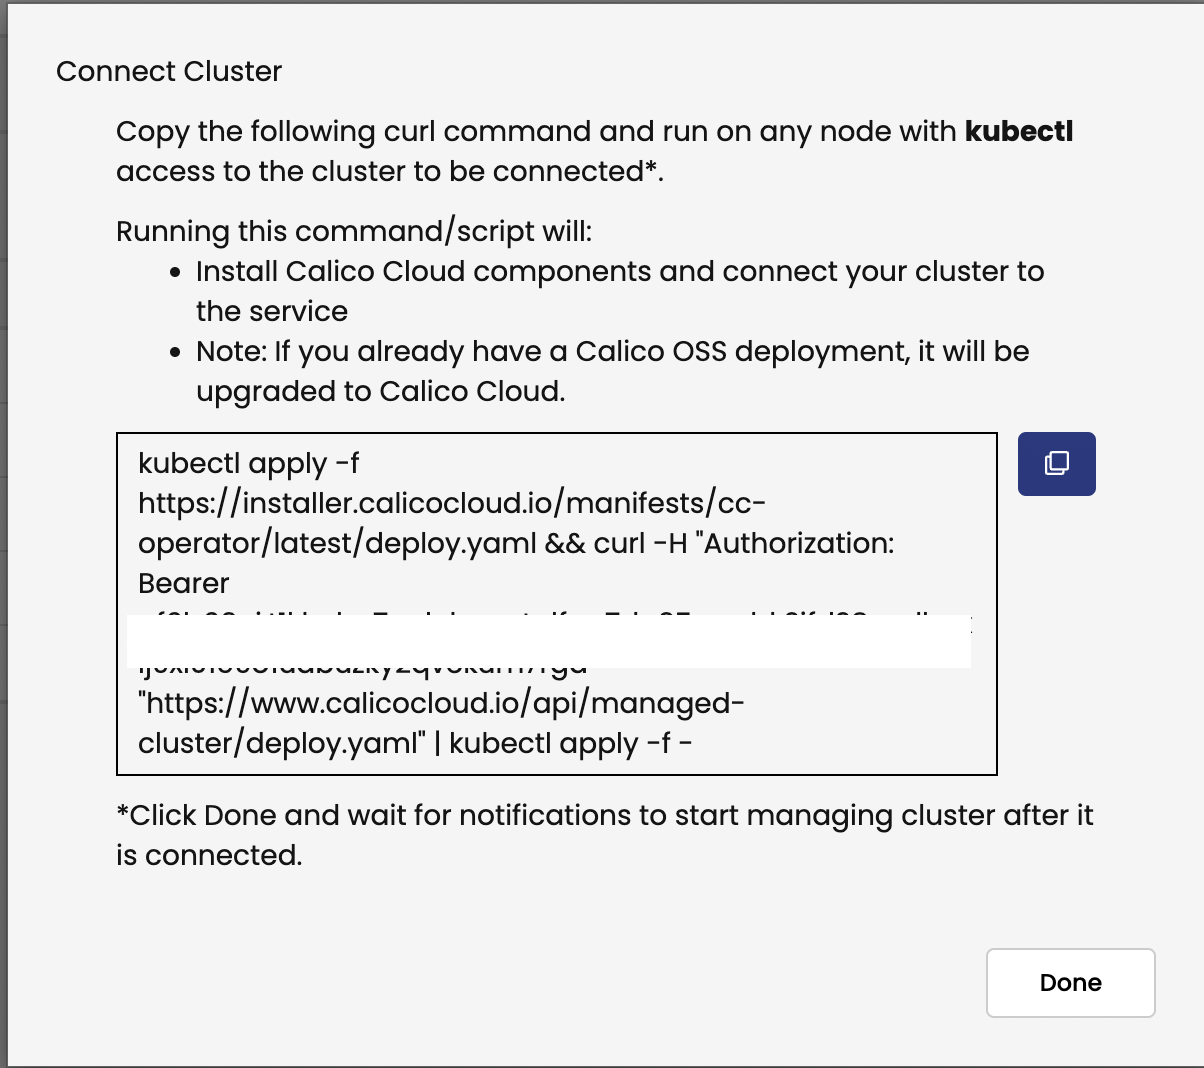
Output should look similar to:
 namespace/calico-cloud created
 namespace/calico-system created
 namespace/tigera-access created
 namespace/tigera-image-assurance created
 namespace/tigera-license created
 namespace/tigera-operator created
 namespace/tigera-operator-cloud created
 namespace/tigera-prometheus created
 namespace/tigera-risk-system created
 customresourcedefinition.apiextensions.k8s.io/installers.operator.calicocloud.io created
 serviceaccount/calico-cloud-controller-manager created
 role.rbac.authorization.k8s.io/calico-cloud-installer-ns-role created
 role.rbac.authorization.k8s.io/calico-cloud-installer-calico-system-role created
 role.rbac.authorization.k8s.io/calico-cloud-installer-kube-system-role created
 role.rbac.authorization.k8s.io/calico-cloud-installer-tigera-image-assurance-role created
 role.rbac.authorization.k8s.io/calico-cloud-installer-tigera-prometheus-role created
 role.rbac.authorization.k8s.io/calico-cloud-installer-tigera-risk-system-role created
 clusterrole.rbac.authorization.k8s.io/calico-cloud-installer-role created
 clusterrole.rbac.authorization.k8s.io/calico-cloud-installer-sa-creator-role created
 clusterrole.rbac.authorization.k8s.io/calico-cloud-installer-tigera-operator-role created
 rolebinding.rbac.authorization.k8s.io/calico-cloud-installer-ns-rbac created
 rolebinding.rbac.authorization.k8s.io/calico-cloud-installer-calico-system-rbac created
 rolebinding.rbac.authorization.k8s.io/calico-cloud-installer-kube-system-rbac created
 rolebinding.rbac.authorization.k8s.io/calico-cloud-installer-tigera-access-rbac created
 rolebinding.rbac.authorization.k8s.io/calico-cloud-installer-tigera-image-assurance-rbac created
 rolebinding.rbac.authorization.k8s.io/calico-cloud-installer-tigera-license-rbac created
 rolebinding.rbac.authorization.k8s.io/calico-cloud-installer-tigera-operator-rbac created
 rolebinding.rbac.authorization.k8s.io/calico-cloud-installer-tigera-operator-rbac created
 rolebinding.rbac.authorization.k8s.io/calico-cloud-installer-tigera-prometheus-rbac created
 rolebinding.rbac.authorization.k8s.io/calico-cloud-installer-tigera-risk-system-rbac created
 clusterrolebinding.rbac.authorization.k8s.io/calico-cloud-installer-crb created
 deployment.apps/calico-cloud-controller-manager created
 % Total    % Received % Xferd  Average Speed   Time    Time     Time  Current
                                 Dload  Upload   Total   Spent    Left  Speed
 100   462  100   462    0     0   1263      0 --:--:-- --:--:-- --:--:--  1265
 secret/api-key created
 installer.operator.calicocloud.io/default created
Joining the cluster to Calico Cloud can take a few minutes. Meanwhile the Calico resources can be monitored until they are all reporting
AvailableasTruekubectl get tigerastatus -w NAME AVAILABLE PROGRESSING DEGRADED SINCE apiserver True False False 2m39s calico True False False 4s cloud-core True False False 2m6s compliance True False False 64s image-assurance True False False 52s intrusion-detection True False False 54s log-collector True False False 39s management-cluster-connection True False False 104s monitor True False False 3m14s policy-recommendation True False False 109s -
Navigating the Calico Cloud UI
Once the cluster has successfully connected to Calico Cloud you can review the cluster status in the UI. Click on
Managed Clustersfrom the left side menu and look for theconnectedstatus of your cluster. You will also see atigera-labscluster for demo purposes. Ensure you are in the correct cluster context by clicking theClusterdropdown in the top right corner. This will list the connected clusters. Click on your cluster to switch context otherwise the current cluster context is in bold font.
-
Configure log aggregation and flush intervals for Calico cluster, we will use 10s instead of default value 300s for lab testing only.
kubectl patch felixconfiguration.p default -p '{"spec":{"flowLogsFlushInterval":"10s"}}' kubectl patch felixconfiguration.p default -p '{"spec":{"dnsLogsFlushInterval":"10s"}}' kubectl patch felixconfiguration.p default -p '{"spec":{"flowLogsFileAggregationKindForAllowed":1}}' kubectl patch felixconfiguration.p default -p '{"spec":{"flowLogsFileAggregationKindForDenied":0}}' kubectl patch felixconfiguration.p default -p '{"spec":{"dnsLogsFileAggregationKind":0}}' -
Configure Felix to collect TCP stats - this uses eBPF TC program and requires minimum Kernel version of v5.3.0. Further documentation
kubectl patch felixconfiguration default -p '{"spec":{"flowLogsCollectTcpStats":true}}'